 Recently I was a panelist at the Electrosmog Festival in Amsterdam. My session was called Hyper-mobility and the urban condition and featured two interesting projects that made use of digital media to attune our increasing mobility to the sustainable development of our cities: Cisco’s Urban Ecomap (part of Connected Urban Development ) presented by Bas Boorsma and In the Air – a project developed in the Medialab Prado and presented by Nerea Calvillo.
Both projects build partly upon the idea of ‘the city as an operating system’ , by which we usually mean that our cities generate more and more data streams on top of which we can build interesting services for either consumers or citizens.
Main question in both projects is: how can we collect and visualize data about environmental pollution to actually change our behaviors? How can we make citizens not only aware of the problem (by visualization of data), but also give them a sense of ‘ownership’ of the problem (it’s not just society’s problem but you are part of it) while at the same time give them an incentive to act (this is what you can do about it)?
Connected Urban Development / Urban Ecomap
With Connected Urban Development Cisco aims to …
… demonstrate how to reduce carbon emissions by introducing fundamental improvements in the efficiency of the urban infrastructure through information and communications technology (ICT).
Boorsma showed two concrete projects Cisco has been taking part in in the Netherlands. One of them was the Urban EcoMap. ‘The important shift for us’, Boorsma explained, ‘is not the shift from atoms to bits, but the shift from bits to decision making’ How can we deploy the use of datastreams to improve our decisions? Or in the words of Cisco:
Urban EcoMap is an interactive decision space that empowers individual citizens to make informed decisions about their daily lives, along with how to participate in the vitality of their communities. We aim to build awareness, fostering a sense of community, and provide actions for citizens to take to enable the reduction of greenhouse gas emissions in cities.
On the ecomap visitors find a per-neighborhood mapping of important environmental statistics, such as CO2 emissions per household, broken down in categories such as transportation, energy and waste.
 The central idea is that behavioral change starts with knowledge and insight in the actual consequences of one’s actions. The urban ecomap could be an interesting contribution to this process.
At the same time, the data of the map is currently quite crude: I can look up what the average CO2-emission per household is in my neighborhood and compare that to other neighborhoods. But I cannot zoom into more detailed levels such as the block where I live.
Nor does Urban Ecomap provide me with insights in what I could contribute to improve the environment. It gives some very general tips like ‘Car Share to work 2-3 times a week’ or ‘Turn off electronic devices’, but there is no way for me to find out exactly how much emissions I will save if I indeed would car share or ride my bike to work. The site does allow me to make up a list of general resolutions to live a more environmental friendly live (and publish those on Facebook), but I never learn what my actual contribution to the problem of urban pollution is, and what I can contribute in alleviating it.
Although I really appreciate Cisco’s central idea, I think there are stil some improvements to make in the execution of the project. Urban Ecomap does give me a general sense of the problem, but as of yet it doesnot really give me a sense of ‘ownership’ of the problem. It would be great if in the future a system like Urban Ecomap would be outfitted with some of the features promised in the PERSONAL TRAVEL ASSISTANT, which is also part of the Connected Urban Development program and that does make a link between personal itinerary and social and environmental impact.
 In the Air
In the Air addresses similar issues as the Urban Ecomap, but it has a different origin. It was developped in the Visualizar workshop organized by the Medialab Prado:
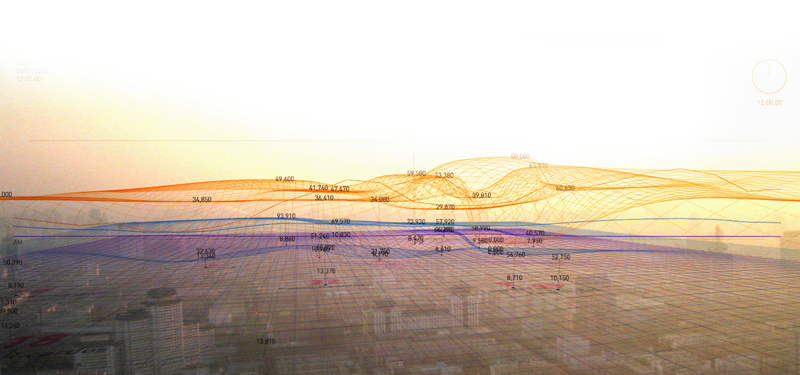
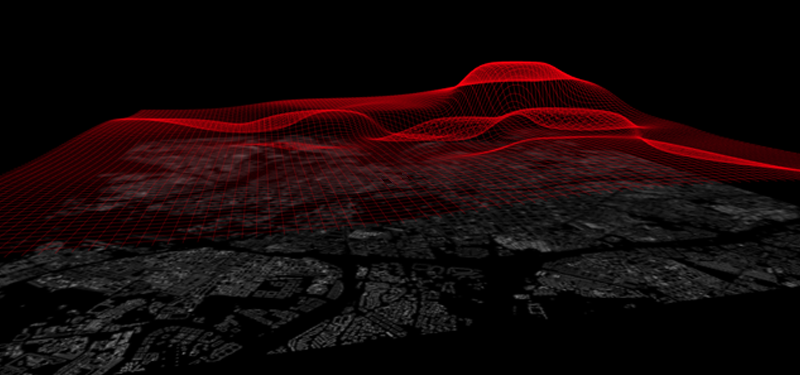
In the Air is a visualization project which aims to make visible the microscopic and invisible agents of Madrid´s air (gases, particles, pollen, diseases, etc), to see how they perform, react and interact with the rest of the of the city.
The project proposes a platform for individual and collective awareness and decision making, where the interpretation of results can be used for real time navigation through the city, opportunistic selection of locations according to their air conditions and a base for political action.
Just like the Ecomap, In the Air visualizes data on a map to inform citizens about pollution in the city. In the air is using real time data provided by the Government of Madrid.
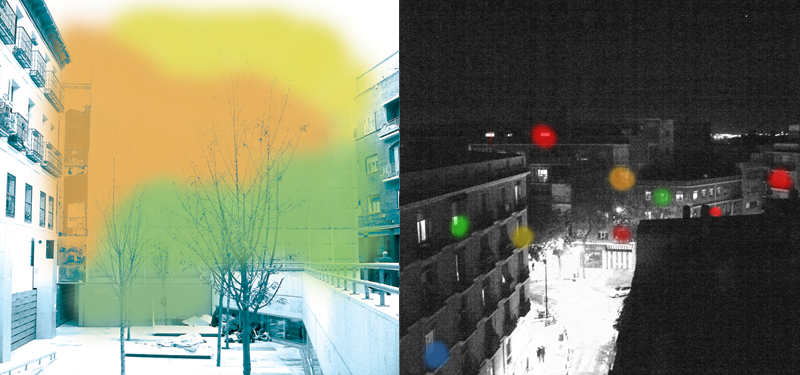
What I found interesting about In the Air is that the designers have been thinking about different interfaces to communicate the datasets. Whereas the Urban Ecomap uses effective but rather boring generic cartesian maps, In the Air shows a set of alternatives. The web interface is a quite beautiful piece of datavis and they are also thinking of bringing the data back into the city. For instance by way of using facades of buildings to reflect a color scheme depending on the levels of pollution or about home units that people can attach to their balconies.
In the air – Physical Prototype from susanna tesconi on Vimeo.
The data collected by In the air can also be linked to individual experiences. They are developing a portable visualization gadget that allows users to see pollution levels nearby. It also shows the impact of taking a bike rather than a car on a certain trip. And it includes a ‘contamination compass’ that directs users away from polluted zones and toward cleaner places in the city. In addition, they are also thinking of creating a bottom-up sensor network, where individuals can also contribute to the data collection process by adopting a sensor and hooking it up to the network.
 |
Although I really liked this presentation, it has its own problem is: In the Air is still a prototpye, all the ideas are there, but I imagine it would be quite a leap to scale this prototype to a full fledged application working city- nation- or worldwide, while making use of data sets that are detailed enough to give actual localized information.
Perhaps then, we would need more cooperation between projects like this. Organizations like Cisco could bring the technological and infrastructural clout to realize projects like this. Initiatives like In the Air are perhaps better suited to initiate original ideas and cultural innovative design that could make them successful.
2 responses to “Cisco’s Urban Ecomaps and Medialab-Prado’s In the Air: How to move from awareness about environmental problems to action?”
[…] are environmental projects that measure air quality and pollution in urban settings (In the Air by Medialab Prado, the work of Eric Paulos and team), noise levels around airports (Geluidsnet), the experience of […]
[…] variable is set, measured, visualized, and therefore can be acted upon. Examples abound. Is the air clean enough to go out? Check! Is the traffic not too dense? Check! Is the house party across the […]